Promotion Impact Analytics
Know exactly what your promotions delivered
TrueLift© measures the true incremental lift of every promotion with statistical rigor—so you can stop guessing and start proving ROI.
The Problem
Promotion measurement shouldn't require a PhD
Most teams rely on crude before-and-after comparisons or expensive consultants to answer a simple question: did the promotion actually work? The result is months of waiting, questionable methodology, and numbers that Finance won't trust.
Waiting weeks for answers
Consultant-led analyses take months. By the time results arrive, the next promotion cycle has already started.
Spreadsheet guesswork
Before-and-after comparisons ignore seasonality, trends, and external factors. The numbers are easy to challenge.
Results that don't hold up
When Finance asks "how do you know?", a gut feeling isn't enough. You need statistical confidence intervals and p-values.
How It Works
From raw data to defensible results in three steps
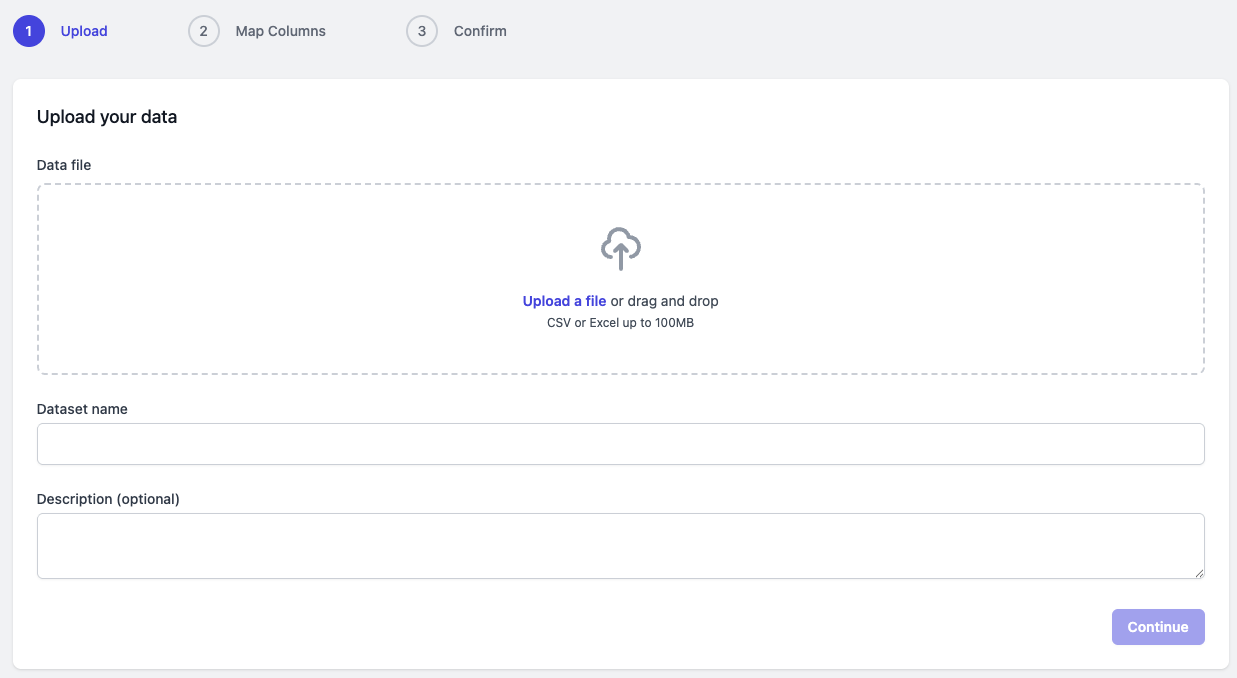
Upload Your Data
Drag and drop your sales data in CSV or Excel format. The wizard automatically detects date columns, metrics, and dimensions—no data prep needed.
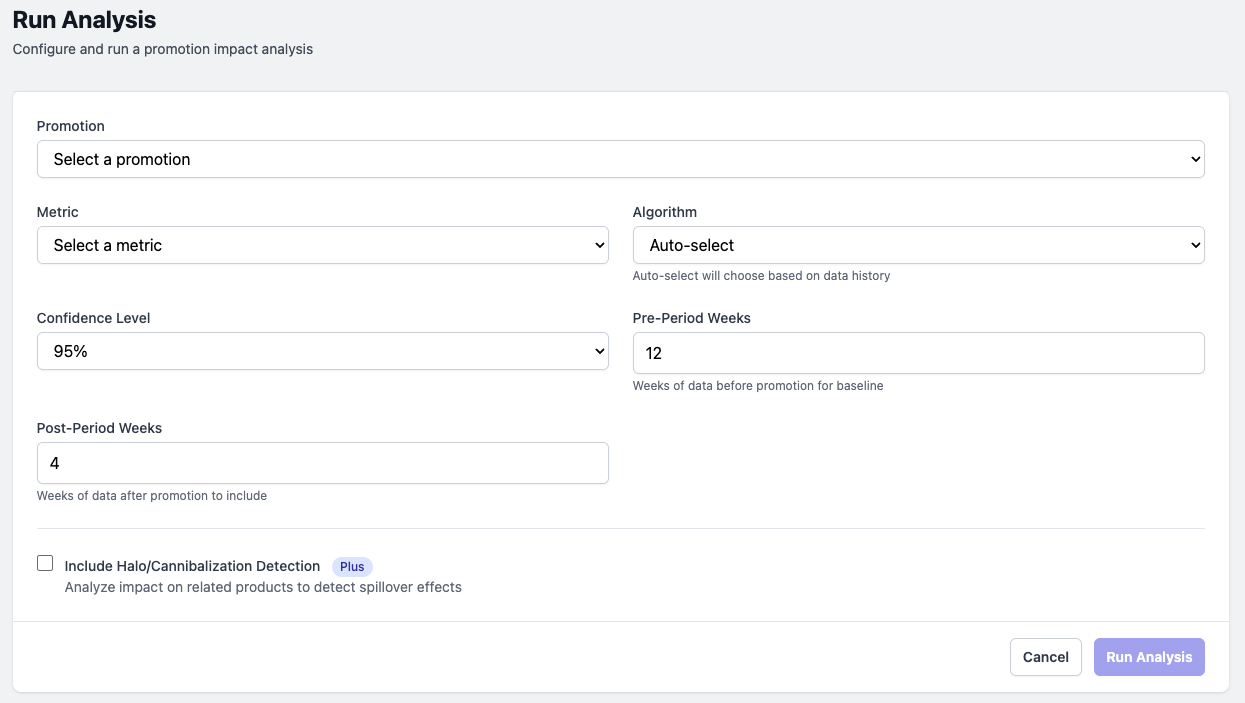
Define Your Promotion
Tell us which product was promoted, when it ran, and which metric to measure. TrueLift© selects the right algorithm and runs the statistics.
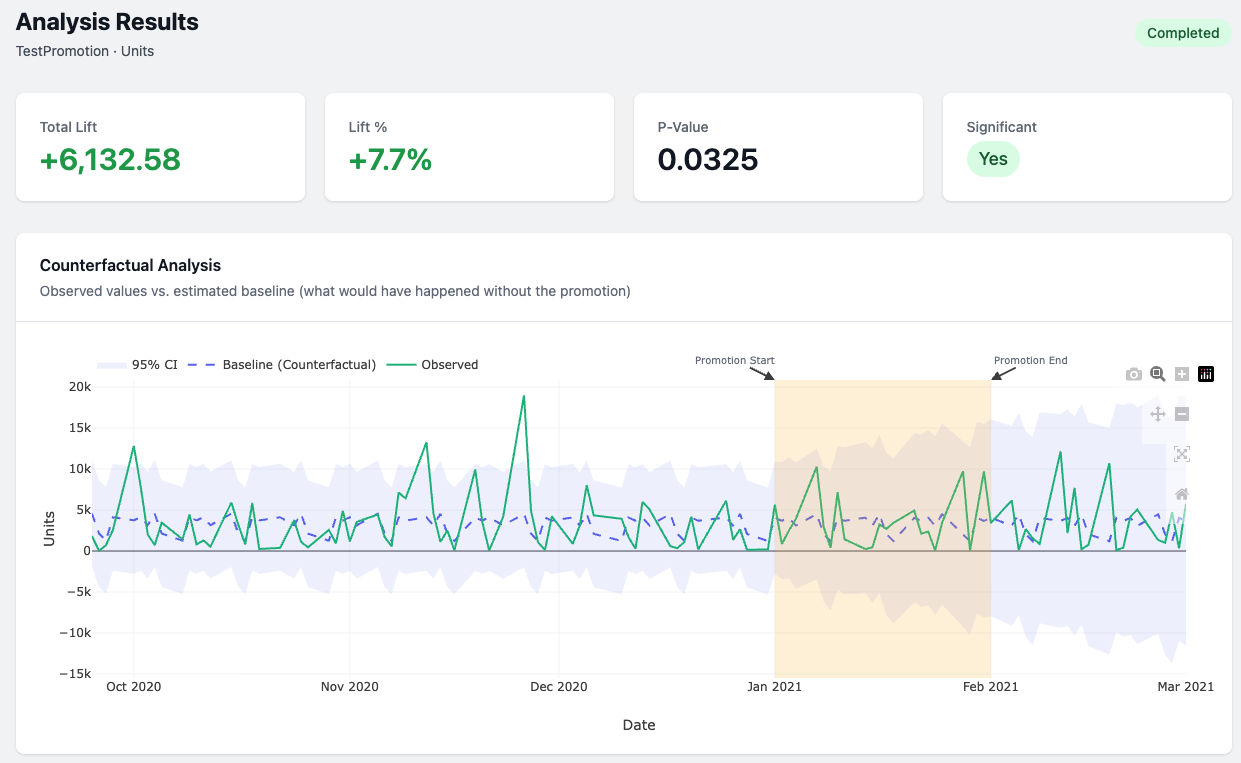
Get Your Results
Within minutes, see the exact incremental impact with confidence intervals, p-values, and interactive charts. Export to PowerPoint in one click.
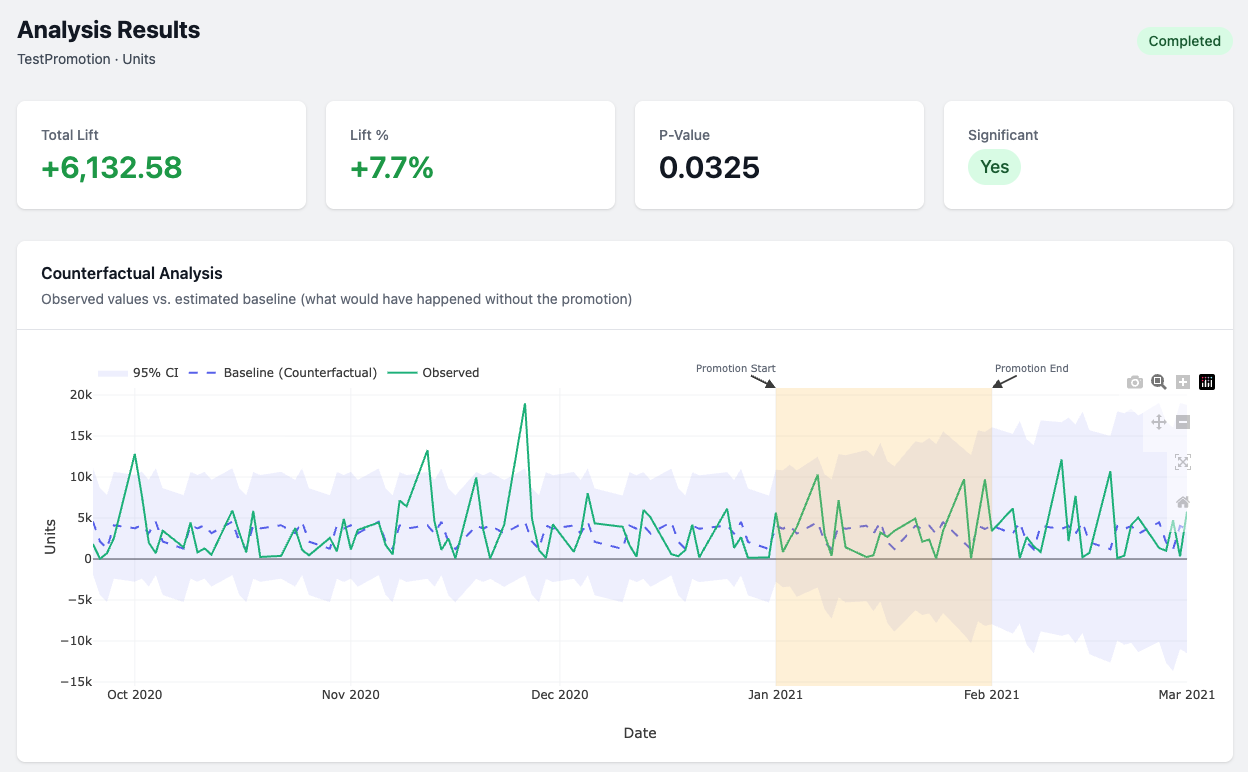
Visual Analytics
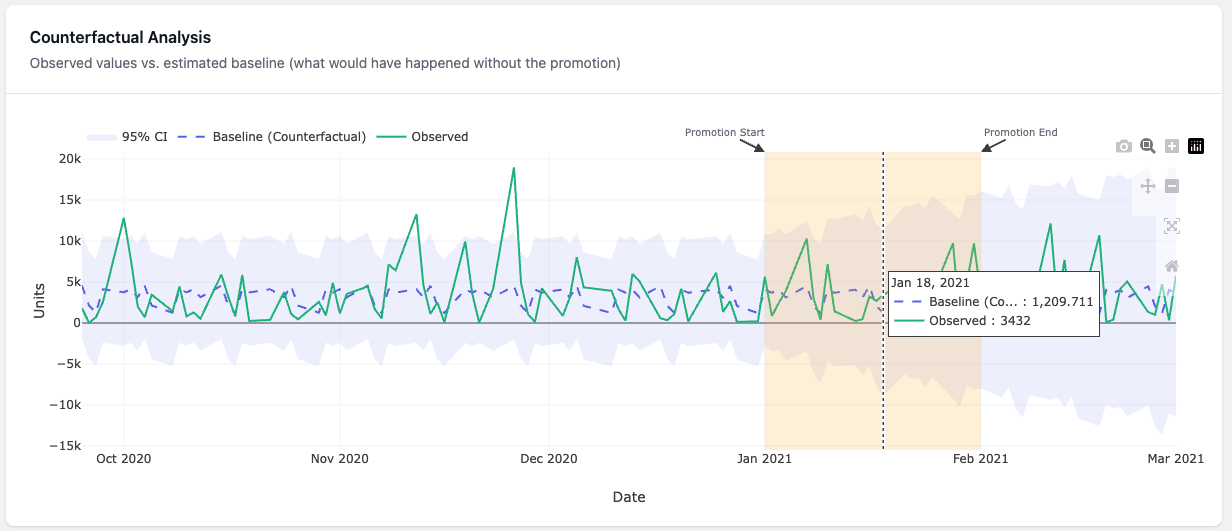
See the counterfactual, not just the numbers
TrueLift© builds a statistical model of what would have happened without your promotion—the counterfactual baseline. Interactive charts show observed performance against this baseline with shaded confidence intervals.
- Interactive charts with hover, zoom, and pan
- Shaded 95% confidence interval bands
- Highlighted promotion period overlay
- Observed vs. counterfactual baseline with clear divergence
Beyond the Promoted Product
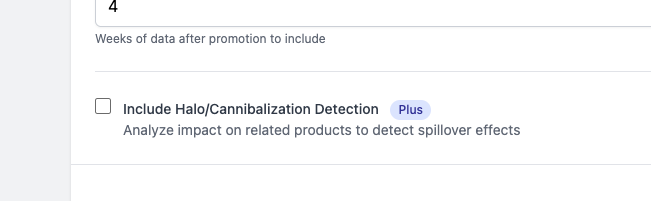
Measure the halo effect—and catch cannibalization
A promotion on craft beer doesn't just affect craft beer. TrueLift©'s halo analysis measures the spillover impact on related, non-promoted products. Did the promotion drive incremental sales across the category? Or did it simply cannibalize from adjacent products? Now you'll know.
- Automatic detection of positive spillover (halo) or negative spillover (cannibalization)
- Statistical significance testing on related product groups
- Combined view of promoted and non-promoted impact for true net ROI
Stakeholder-Ready Output
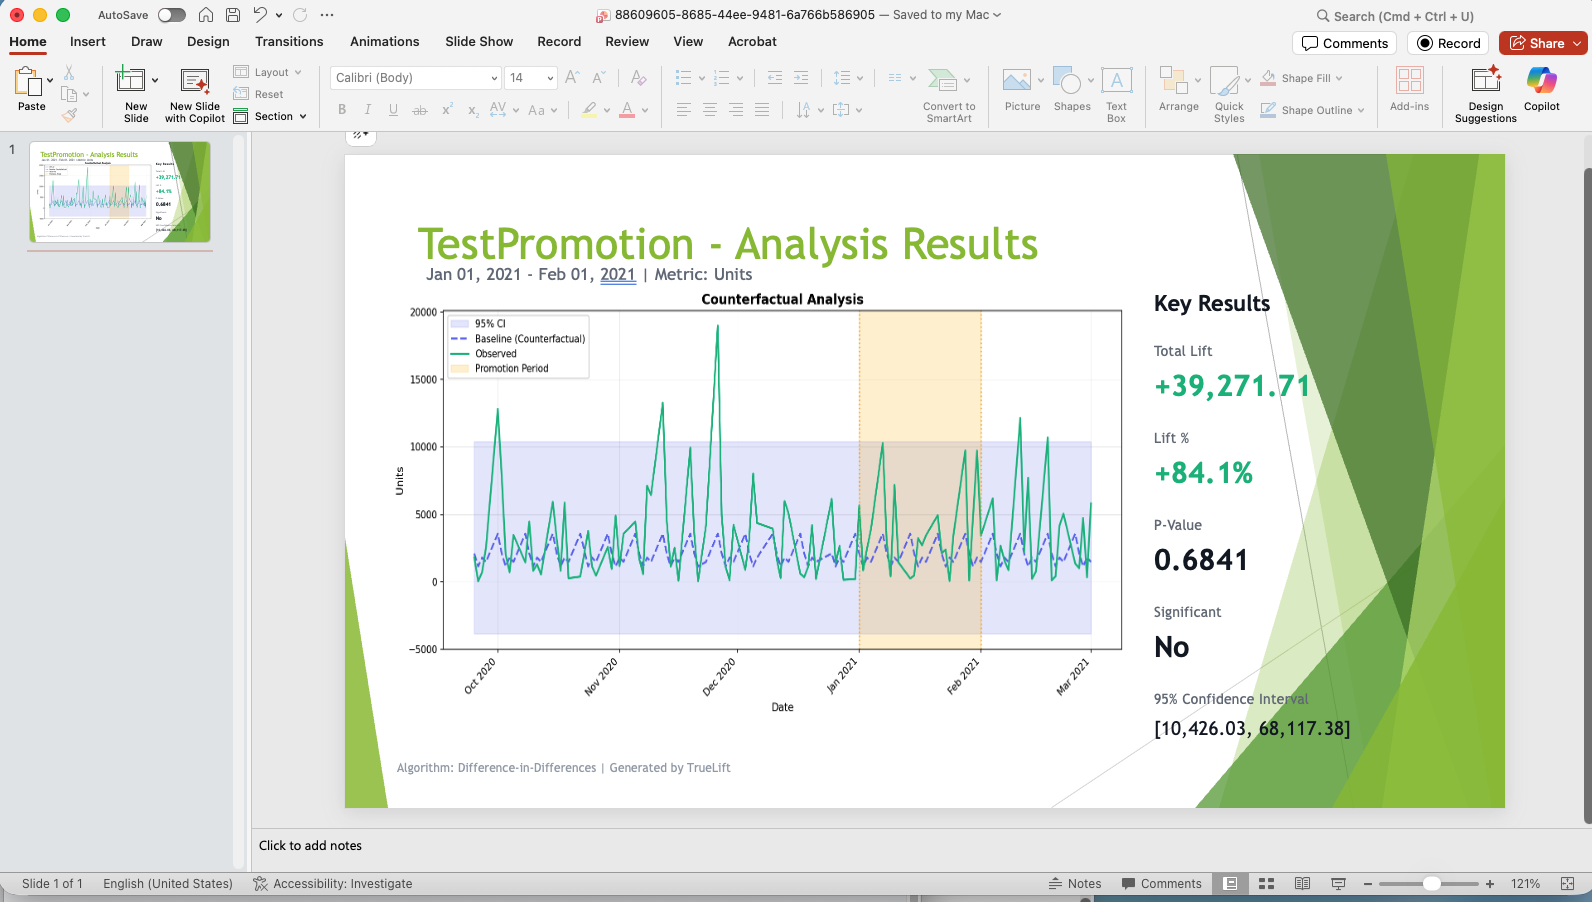
From analysis to boardroom in one click
Your CFO doesn't want to log into another tool. TrueLift© exports publication-quality results directly to PowerPoint—chart, key metrics, confidence intervals, and methodology footnote included. Upload your company's slide template and every export matches your brand.
- One-click PowerPoint export with chart and key metrics
- Custom template support: upload your company's .pptx template
- Includes methodology footnote for auditability
- Results formatted for executive audiences: lift numbers, significance, CI range
Plan Before You Spend
Know if you'll detect the effect before you run the promotion
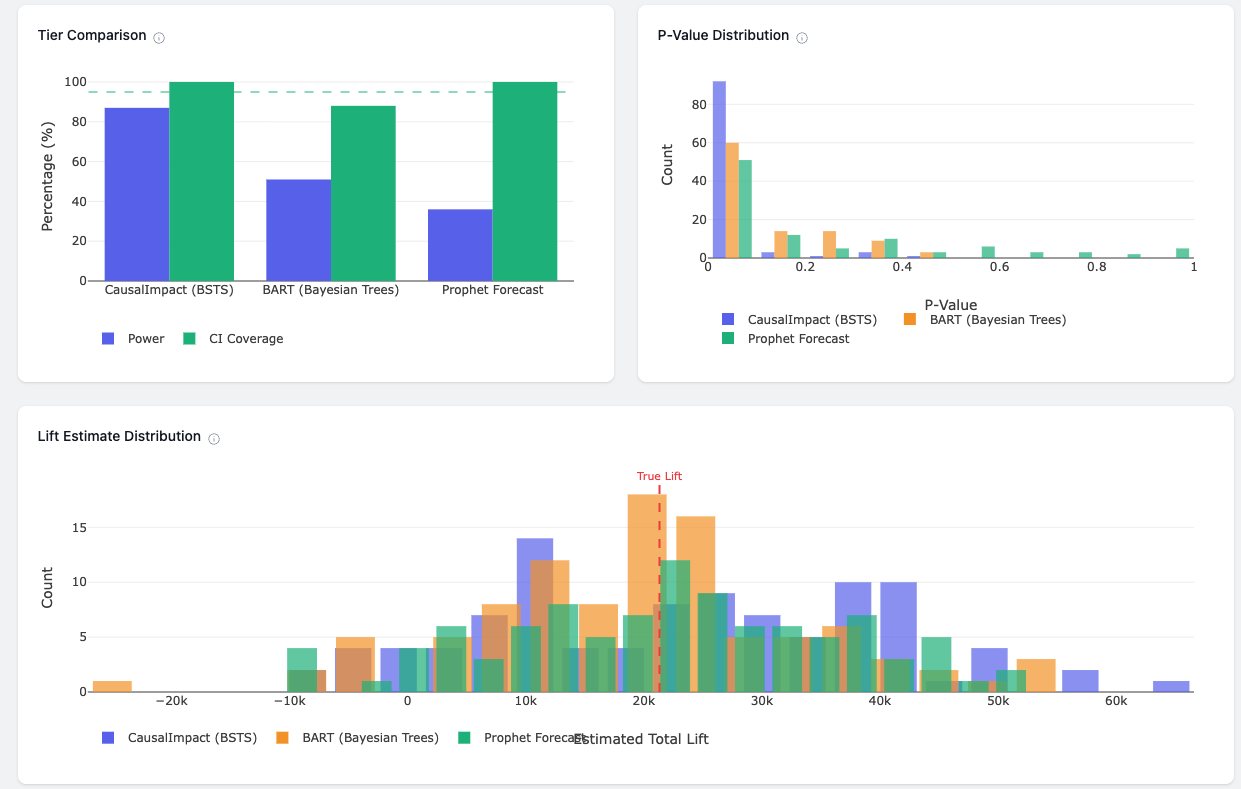
Don't commit budget to a promotion and hope for the best. TrueLift©'s simulation engine lets you model your promotion scenario against real data characteristics—testing all 5 algorithms to see which reliably detects your expected effect. Get GO / CAUTION / NOT RECOMMENDED verdicts with detection power percentages, and model ROI across discount levels to find the optimal price point.
- Auto-calibrate from your real data: seasonality, noise, and trends
- Compare all 5 algorithm tiers side-by-side
- Statistical power analysis: know your detection rate before committing
- ROI sensitivity: find the discount level that maximizes profit
Built for Teams
Everything your team needs to measure promotion ROI
Unlimited datasets and analyses
No per-analysis fees or data caps. Upload as many datasets and run as many analyses as your organization needs.
No statistician required
TrueLift© automatically selects the best algorithm for your data. You pick the promotion; we pick the math.
Five tiers of statistical rigor
Difference-in-Differences, STL Decomposition, CausalImpact, BART, and Prophet. Auto mode picks the best fit for your data.
Drill down by any dimension
Break down results by store, region, product variant, or any dimension in your data. See which segments drove the lift.
Defensible for Finance
Every result includes p-values, confidence intervals, and effect sizes. Automatic promotion ROI calculates incremental revenue vs. discount cost.
Simulate before you spend
Run Monte Carlo simulations to test detection power and model ROI before committing to a promotion.
Built on proven causal inference methods
5 Algorithm Tiers
From simple DiD to Prophet and Bayesian Structural Time Series
95% Default Confidence
Statistical rigor baked into every analysis
Seconds, Not Months
Results in minutes instead of consultant timelines
Stop guessing. Start measuring.
Create your account and run your first promotion impact analysis today.
Already have an account? Sign in